Risk Register
Video transcript
00:04 — Risk Register
The Risk Register tracks program risk on a likelihood-by-consequence matrix. Start blank and ask the agent to draft it — approving as it goes. Each risk comes back with its cause, its effect, a rating and a mitigation, and the heat-map shows at a glance where the program is exposed. It can even pull your highest-risk failure modes straight from the DFMEA, so design risk and program risk stay connected.
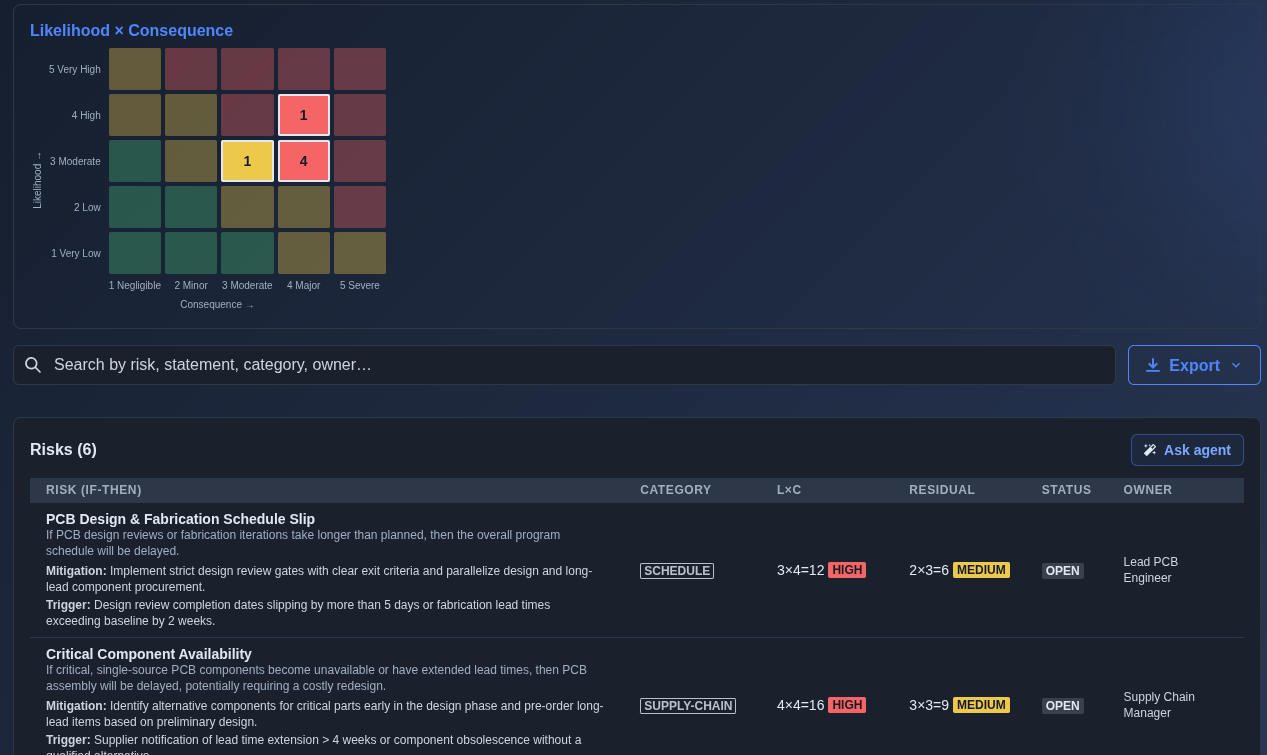
A Likelihood × Consequence heat-map for program-level risk.
What it's for
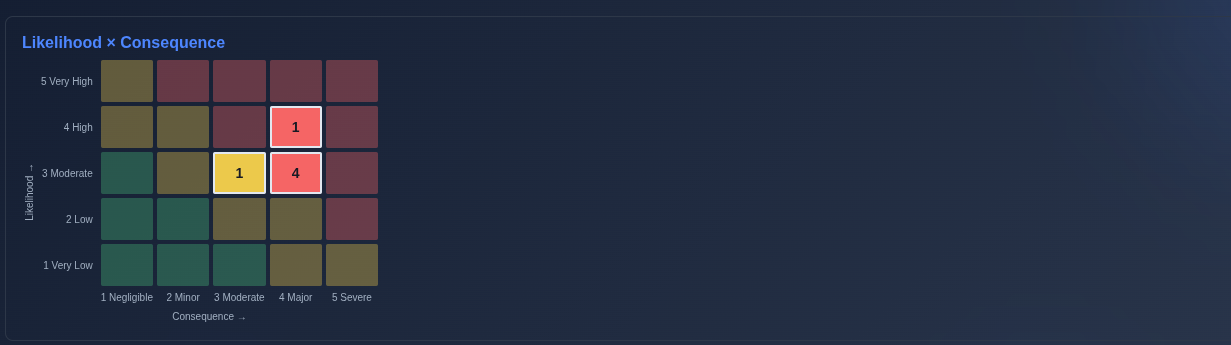
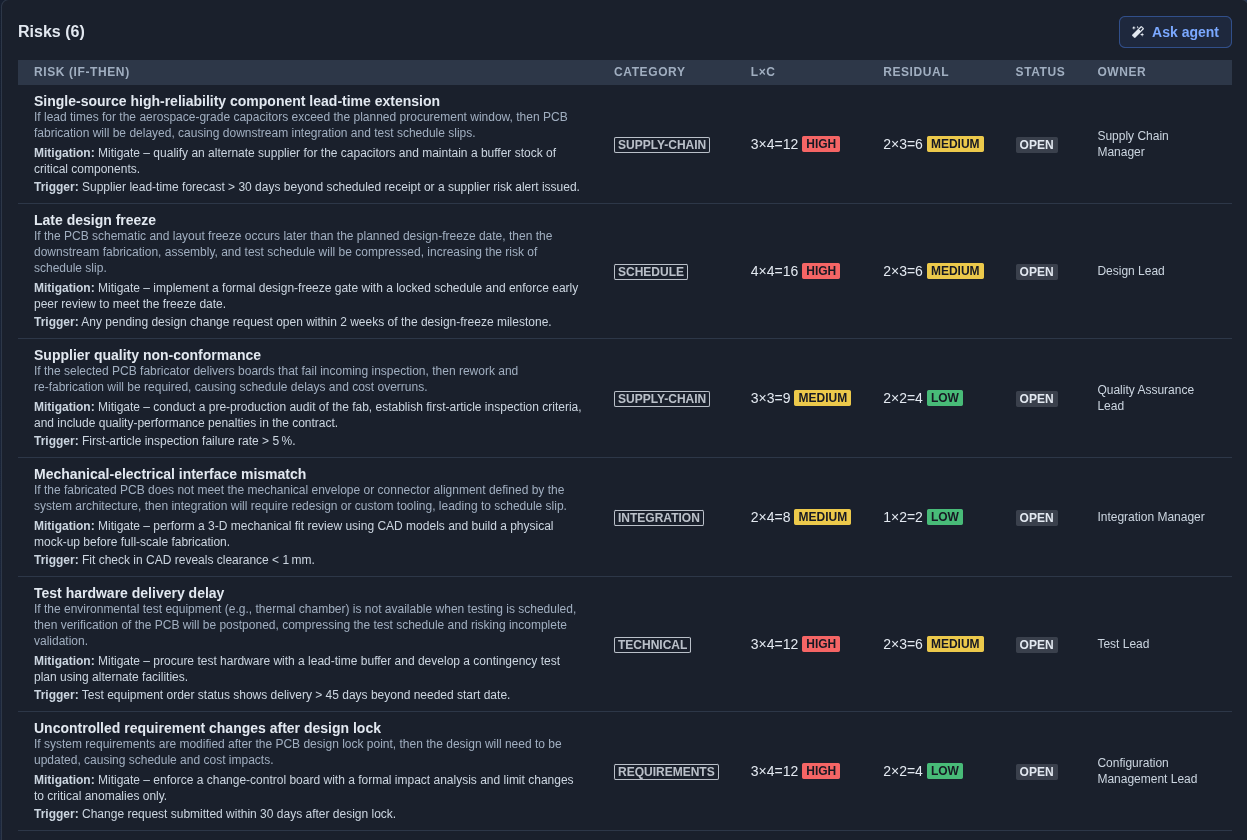
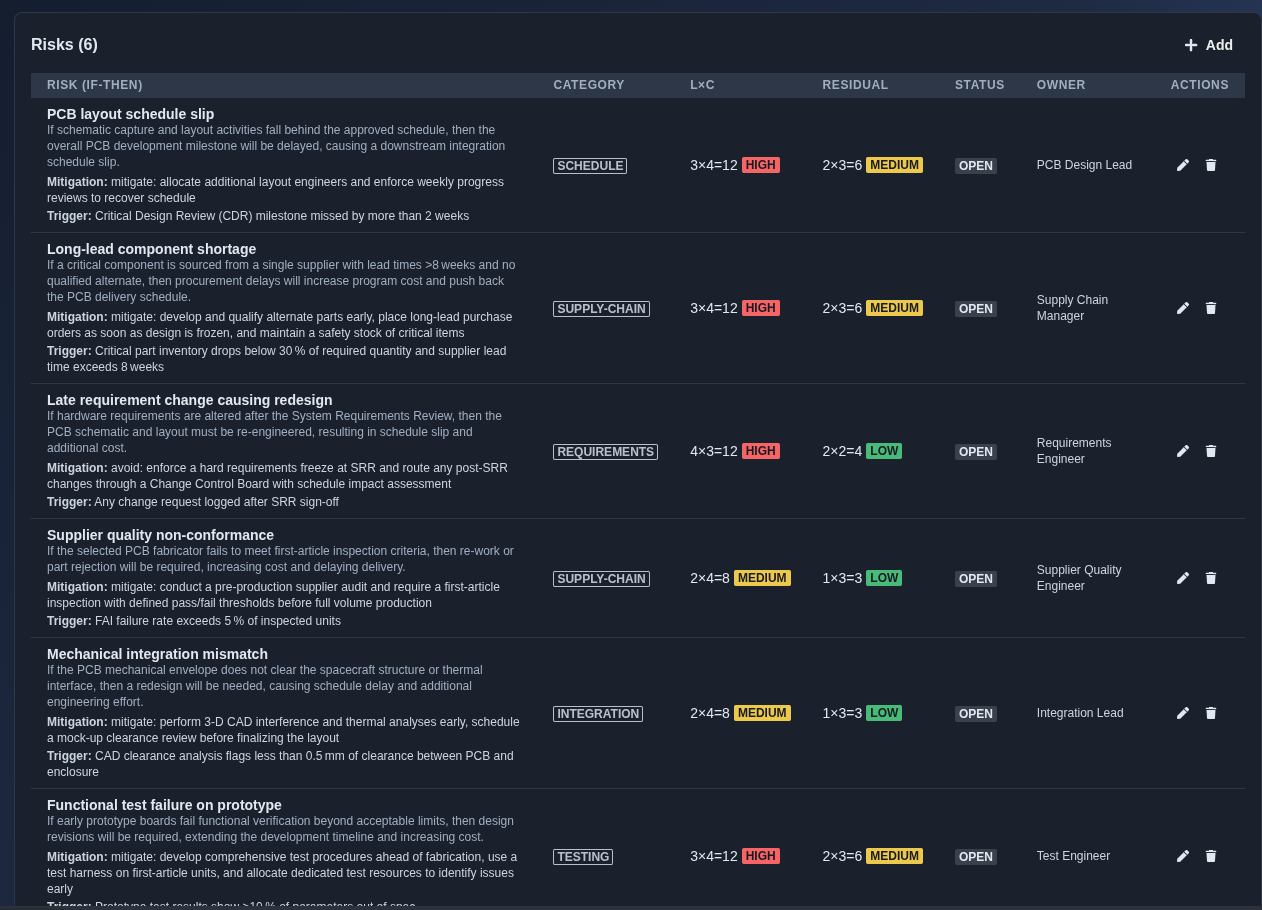
The program risk register (NASA Process 13). A read-only 5×5 Likelihood × Consequence heat map — each cell is tinted by risk band and shows the number of risks in that cell — sits above a table of if-then risks, each with a category, L×C score and band, residual (post-mitigation) score and band, an owner, a status, mitigation, and an early-warning trigger.
When to use it
Use the Risk Register throughout the program lifecycle and review it at each major program gate.
How it works
-
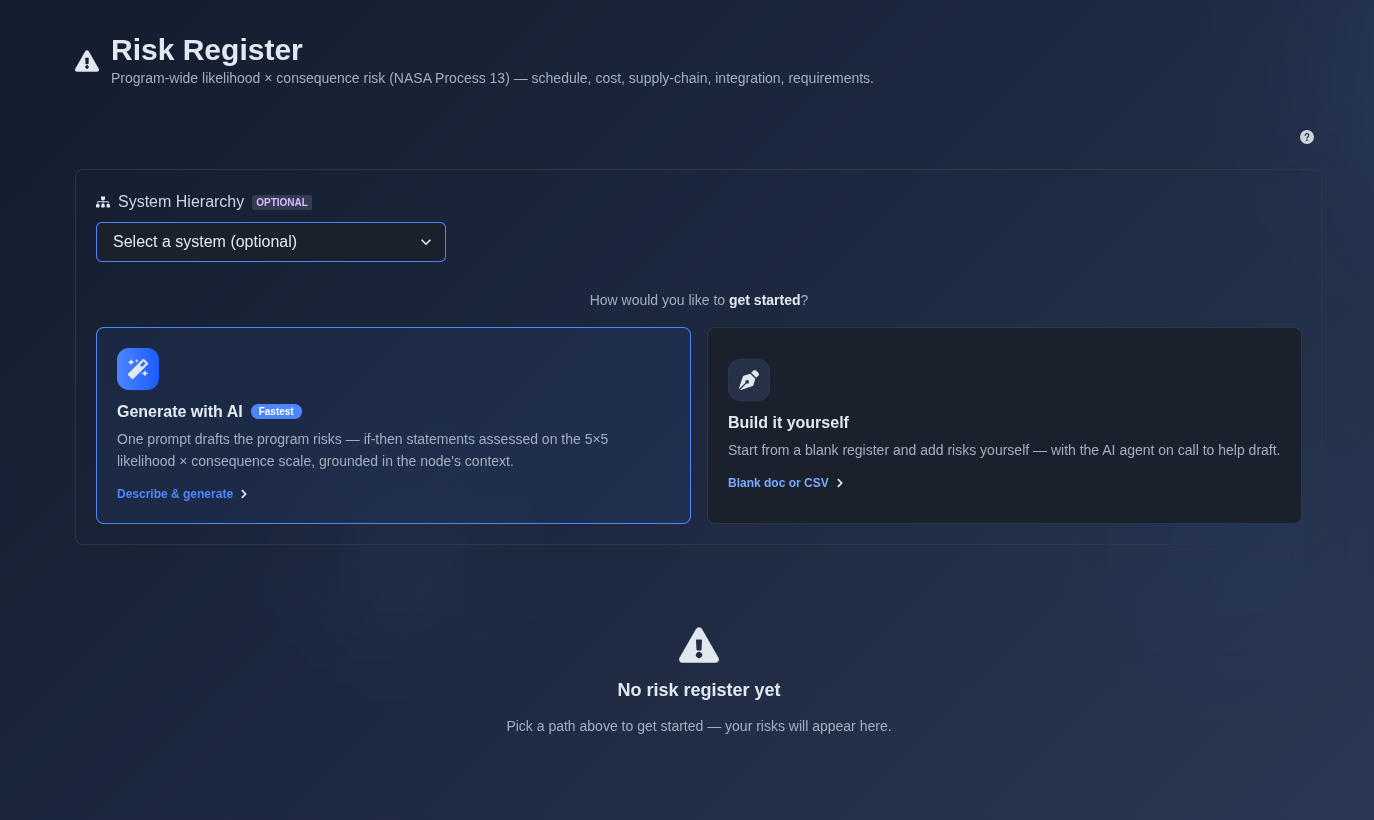
Generate with AI or build it yourself. → Select “Generate with AI” or “Build it yourself.” If “Generate with AI” is selected, enter a prompt describing the program risks you want to assess, and the AI generates an initial Risk Register using a 5×5 likelihood × consequence scale. If “Build it yourself” is selected, choose “Create a blank document” to start with an empty Risk Register and add risks manually, or choose “Import from CSV” to upload or paste a risk list.
▶ Initial state▼ Initial state
-
Review the Likelihood × Consequence matrix. → Review the risk distribution on the 5×5 matrix, where the vertical axis represents Likelihood from 1 (Very Low) to 5 (Very High), and the horizontal axis represents Consequence from 1 (Negligible) to 5 (Severe). Each cell displays the number of risks with that likelihood and consequence combination, helping identify areas with higher concentrations of risk.
▶ Likelihood × Consequence matrix▼ Likelihood × Consequence matrix
-
Review the risks. → Review the listed risks and their key details, including the risk if-then statement, category, Likelihood × Consequence (L×C) score and rating, residual risk score and rating, status, and assigned owner. Each risk also includes its Mitigation and Trigger information to understand the planned risk response and the condition that activates the risk.
▶ Risks▼ Risks
-
Add, edit, or delete risks. → In AI-generated Risk Register, Add, Edit, and Delete controls are available only in the follow-on prompt view and are disabled in the main prompt view. In manually created Risk Register, Add, Edit, and Delete controls are available directly in the main document view.
▶ Add, edit, or delete risks.▼ Add, edit, or delete risks.
-
Export the Risk Register. → Click “Export” and select the required output format: “PDF” for a formatted PDF with a cover page and page numbers, “CSV Spreadsheet” for Excel or Google Sheets, or “JSON Data” for structured data.
▶ Export the Risk Register.▼ Export the Risk Register.

Mechanics
- Read-only 5×5 Likelihood × Consequence heat map with live cell counts
- If-then risk statements · category · owner · status
- Likelihood × Consequence score and risk band · residual risk scoring
- Mitigation and early-warning trigger fields
- Add · Edit · Delete controls with follow-on editing for AI-generated risks
- Export: PDF · CSV Spreadsheet · JSON Data