Flowchart
Video transcript
00:04 — Flowchart
The flowchart tool turns a process or a piece of logic into a clean diagram. Start blank and ask the agent to draft the unlock sequence for the door lock — approving as it goes. Decisions, branches and flows come back laid out and connected: a readable flowchart in seconds that you edit rather than draw from scratch.
Control and process logic, drawn from text.
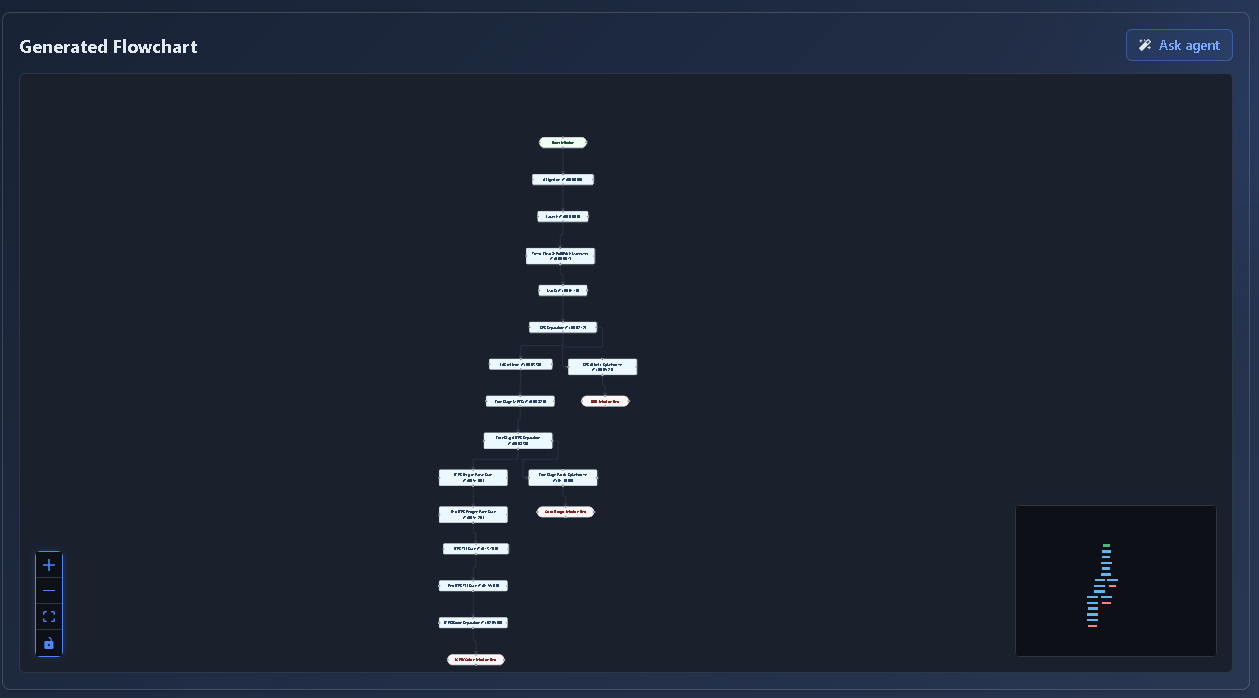
What it's for
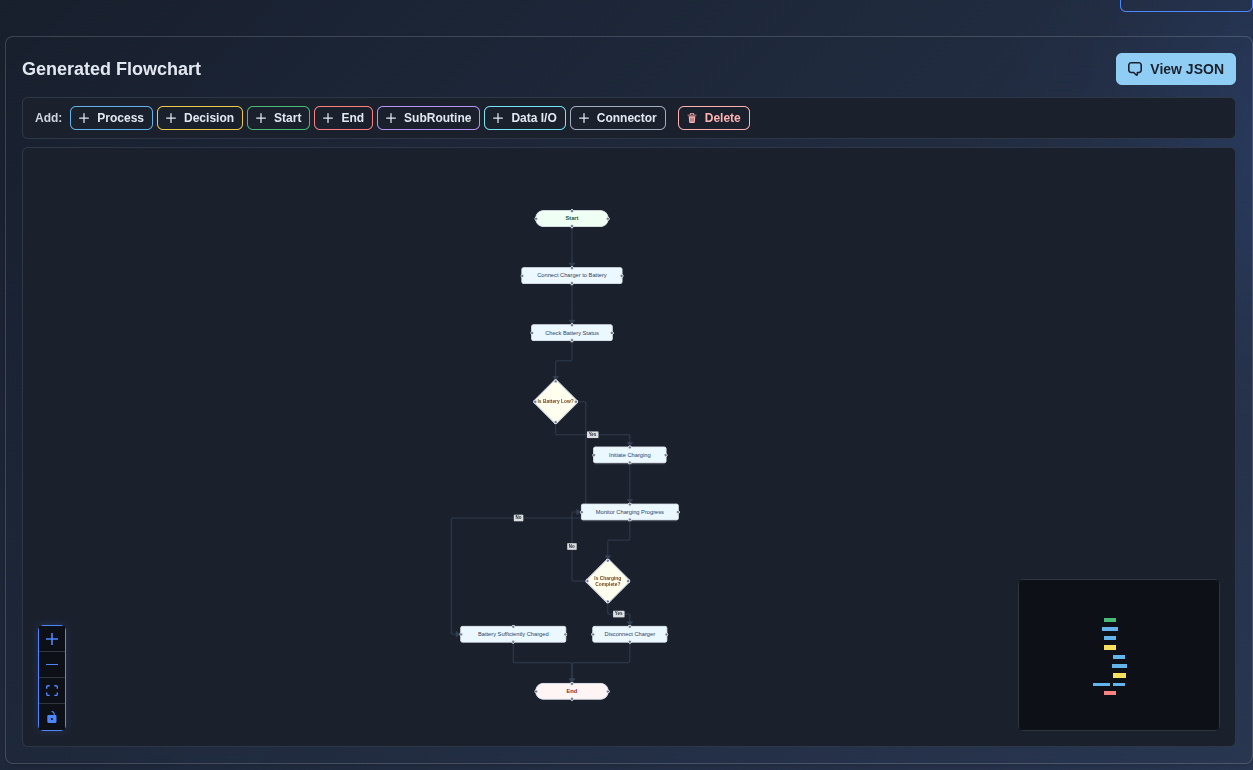
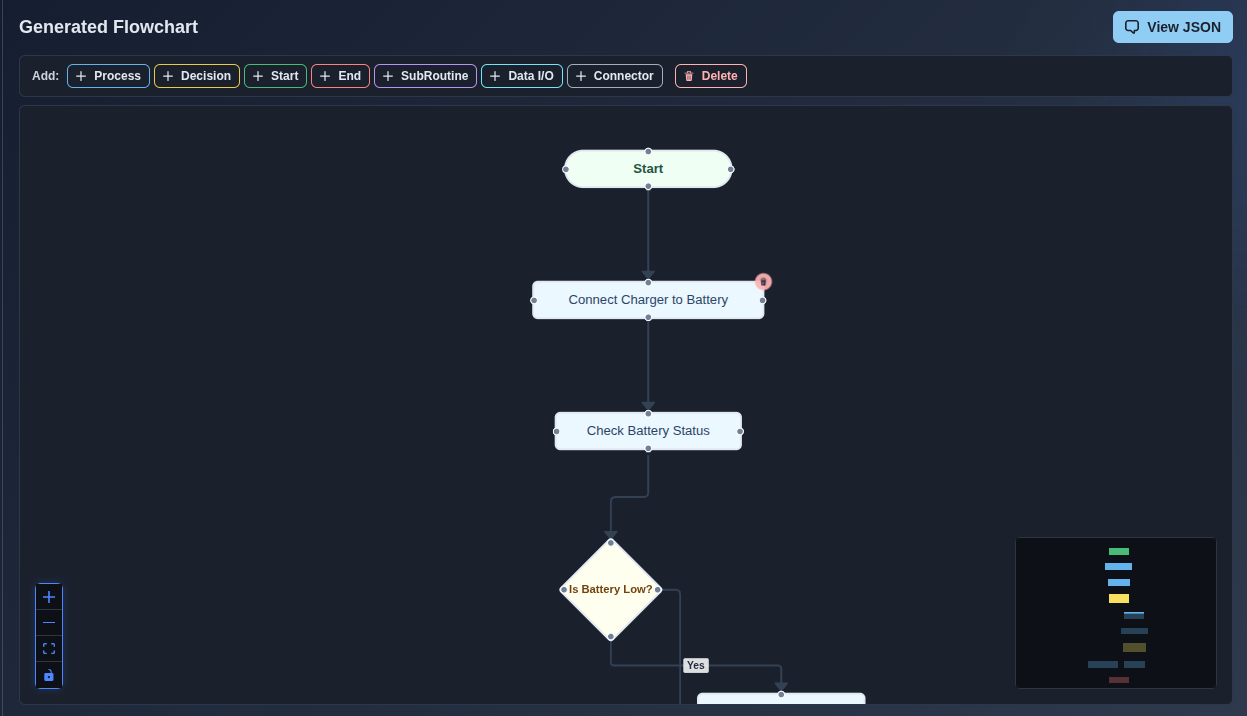
An interactive React-Flow canvas with seven node types — Start/End terminals, Process, Decision, SubRoutine, Data I/O and Connector. Every node has North/South/East/West anchors for clean edges, and decision branches carry outcome labels (Yes/No).
When to use it
Control logic, decision trees, and manufacturing or test workflows.
How it works
-
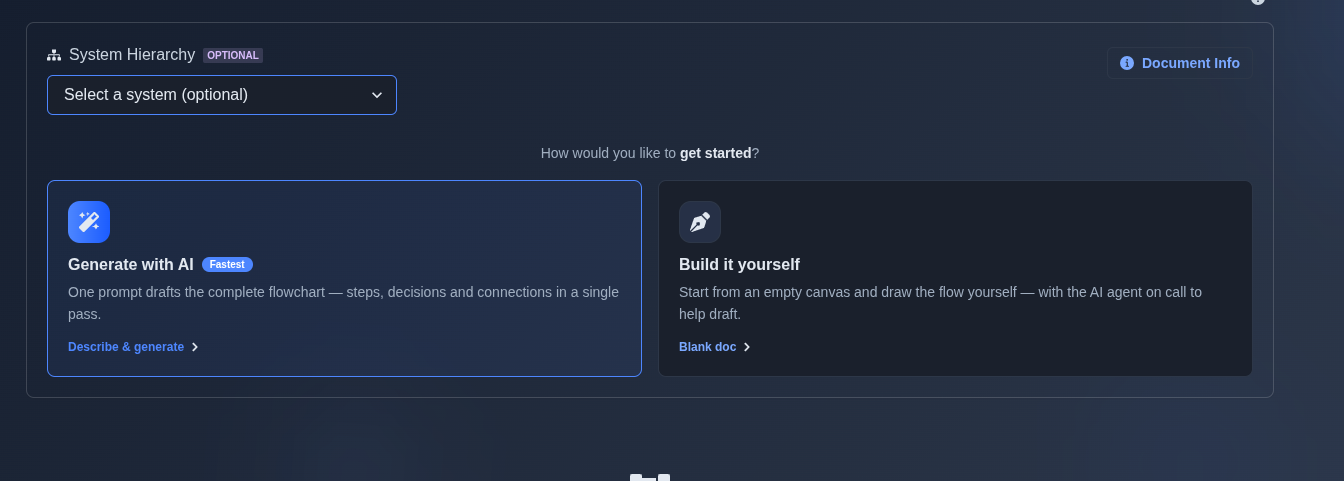
Generate Flowchart from a prompt (or start blank). → Select how you want to create the flowchart — “Generate with AI” or “Build it yourself.” If “Generate with AI” is selected, optionally select a system and node, enter a prompt, and run it to generate the flowchart automatically. If “Build it yourself” is selected, choose “Create a blank document” and create the flowchart manually on the canvas.
▶ Initial State▼ Initial State
-
Add nodes from the in-canvas toolbar and wire them. → Use the “Add:” buttons to add Process, Decision, Start, End, SubRoutine, Data I/O, or Connector nodes. Connect nodes using their anchors to create the flow, and label Decision branches with outcomes such as Yes/No. Use Delete to remove nodes. For AI-generated flowcharts, use Follow-on mode to add, edit, delete, or modify nodes and connections.
▶ Add nodes▼ Add nodes
-
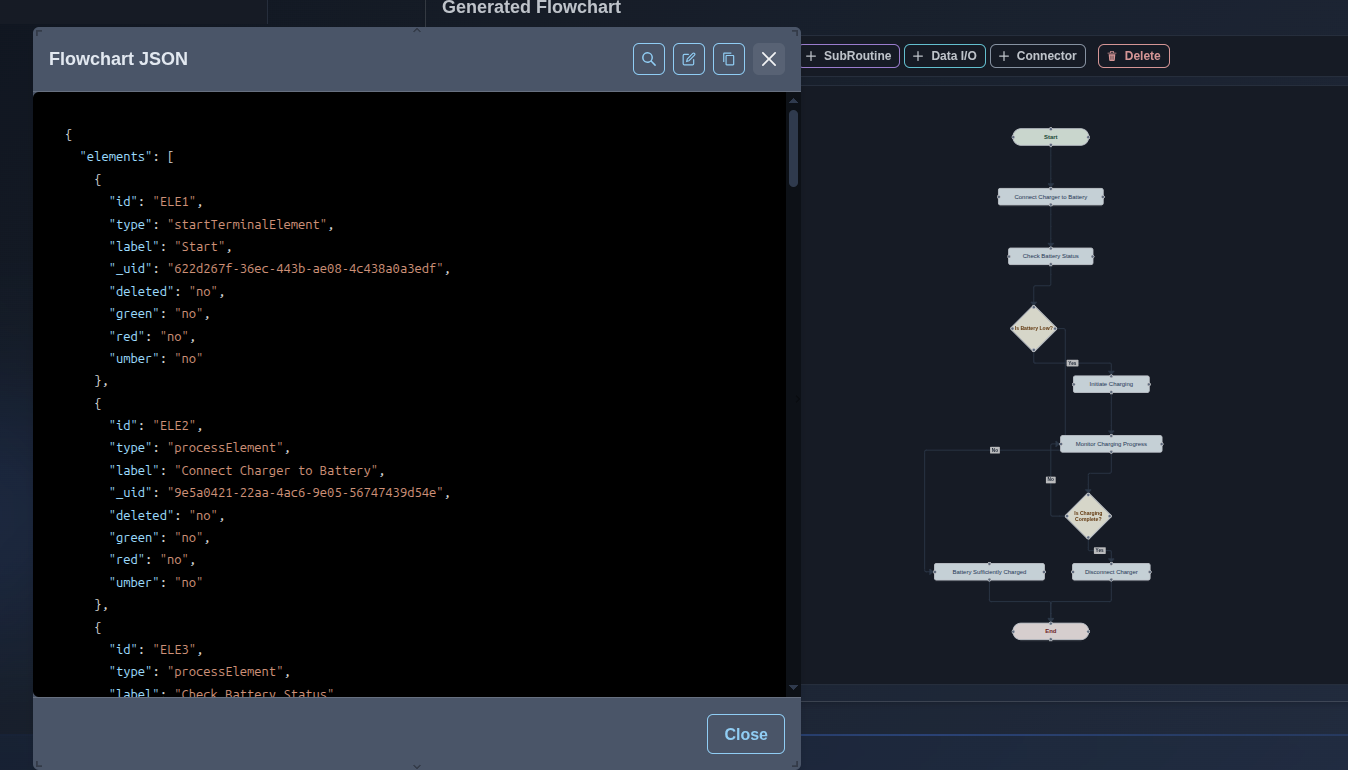
View and edit the flowchart JSON. → Click “View JSON” to display the flowchart data. Select the Edit option to modify the JSON, then save your changes. The updated JSON data is applied to the flowchart and the corresponding changes are displayed on the canvas.
▶ View and edit the flowchart JSON▼ View and edit the flowchart JSON
-
Double click to edit; drag to reposition; hover to delete. → Double-click a node label to edit its text, press Enter or click outside to save the change, drag nodes to reposition them, and hover over a node to delete it. The changes are applied directly to the flowchart canvas.
▶ Double click to edit; drag to reposition; hover to delete.▼ Double click to edit; drag to reposition; hover to delete.
-
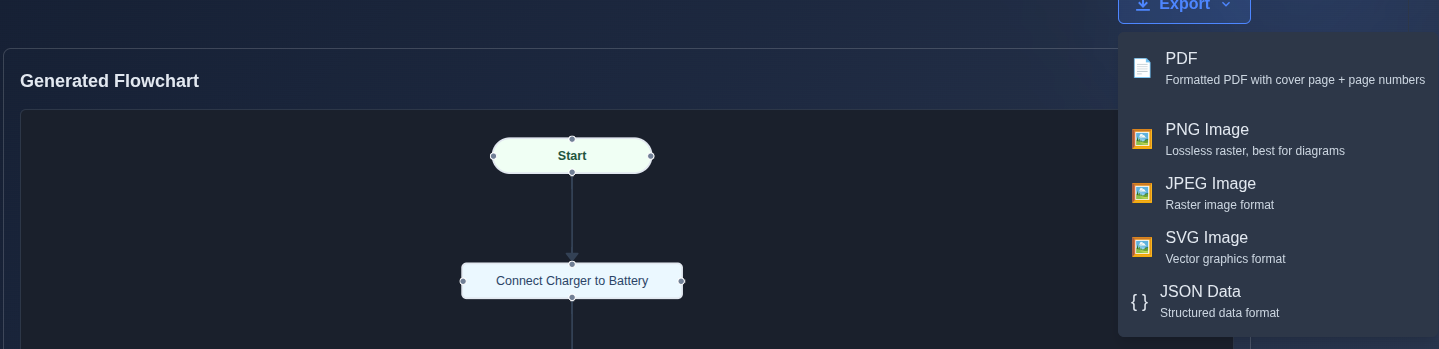
Export the flowchart. → Open the “Export” menu and select the required format: PDF, PNG Image, JPEG Image, SVG Image, or JSON Data. The flowchart is exported in the selected format, with PDF providing a formatted document and PNG, JPEG, and SVG providing image versions of the flowchart.
▶ Export▼ Export
Mechanics
- React-Flow canvas · minimap · 7 node types · N/S/E/W anchors
- Decision-branch edge labels · in-canvas Add-node toolbar
- Inline label edit · drag layout · JSON round-trip editor
- Follow-on-gated editing · revisions · review
- Export: PDF · stamped PDF · PNG · JPEG · SVG · JSON (vector-rebuilt)